Add Exposures to your DAG
Exposures make it possible to define and describe a downstream use of your dbt project, such as in a dashboard, application, or data science pipeline. By defining exposures, you can then:
- run, test, and list resources that feed into your exposure
- populate a dedicated page in the auto-generated documentation site with context relevant to data consumers
Declaring an exposure
Exposures are defined in .yml files nested under an exposures: key.
models/<filename>.yml
version: 2

exposures:

  - name: weekly_jaffle_metrics
    label: Jaffles by the Week
    type: dashboard
    maturity: high
    url: https://bi.tool/dashboards/1
    description: >
      Did someone say "exponential growth"?

    depends_on:
      - ref('fct_orders')
      - ref('dim_customers')
      - source('gsheets', 'goals')
      - metric('count_orders')

    owner:
      name: Callum McData
      email: data@jaffleshop.com
Available properties
Required:
- name: a unique exposure name written in snake case
- type: one of
dashboard,notebook,analysis,ml,application(used to organize in docs site) - owner:
nameoremailrequired; additional properties allowed
Expected:
- depends_on: list of refable nodes, including
metric,ref, andsource. While possible, it is highly unlikely you will ever need anexposureto depend on asourcedirectly.
Optional:
- label: May contain spaces, capital letters, or special characters.
- url: Activates and populates the link to View this exposure in the upper right corner of the generated documentation site
- maturity: Indicates the level of confidence or stability in the exposure. One of
high,medium, orlow. For example, you could usehighmaturity for a well-established dashboard, widely used and trusted within your organization. Uselowmaturity for a new or experimental analysis.
General properties (optional)
- description
- tags
- meta
Referencing exposures
Once an exposure is defined, you can run commands that reference it:
dbt run -s +exposure:weekly_jaffle_report
dbt test -s +exposure:weekly_jaffle_report
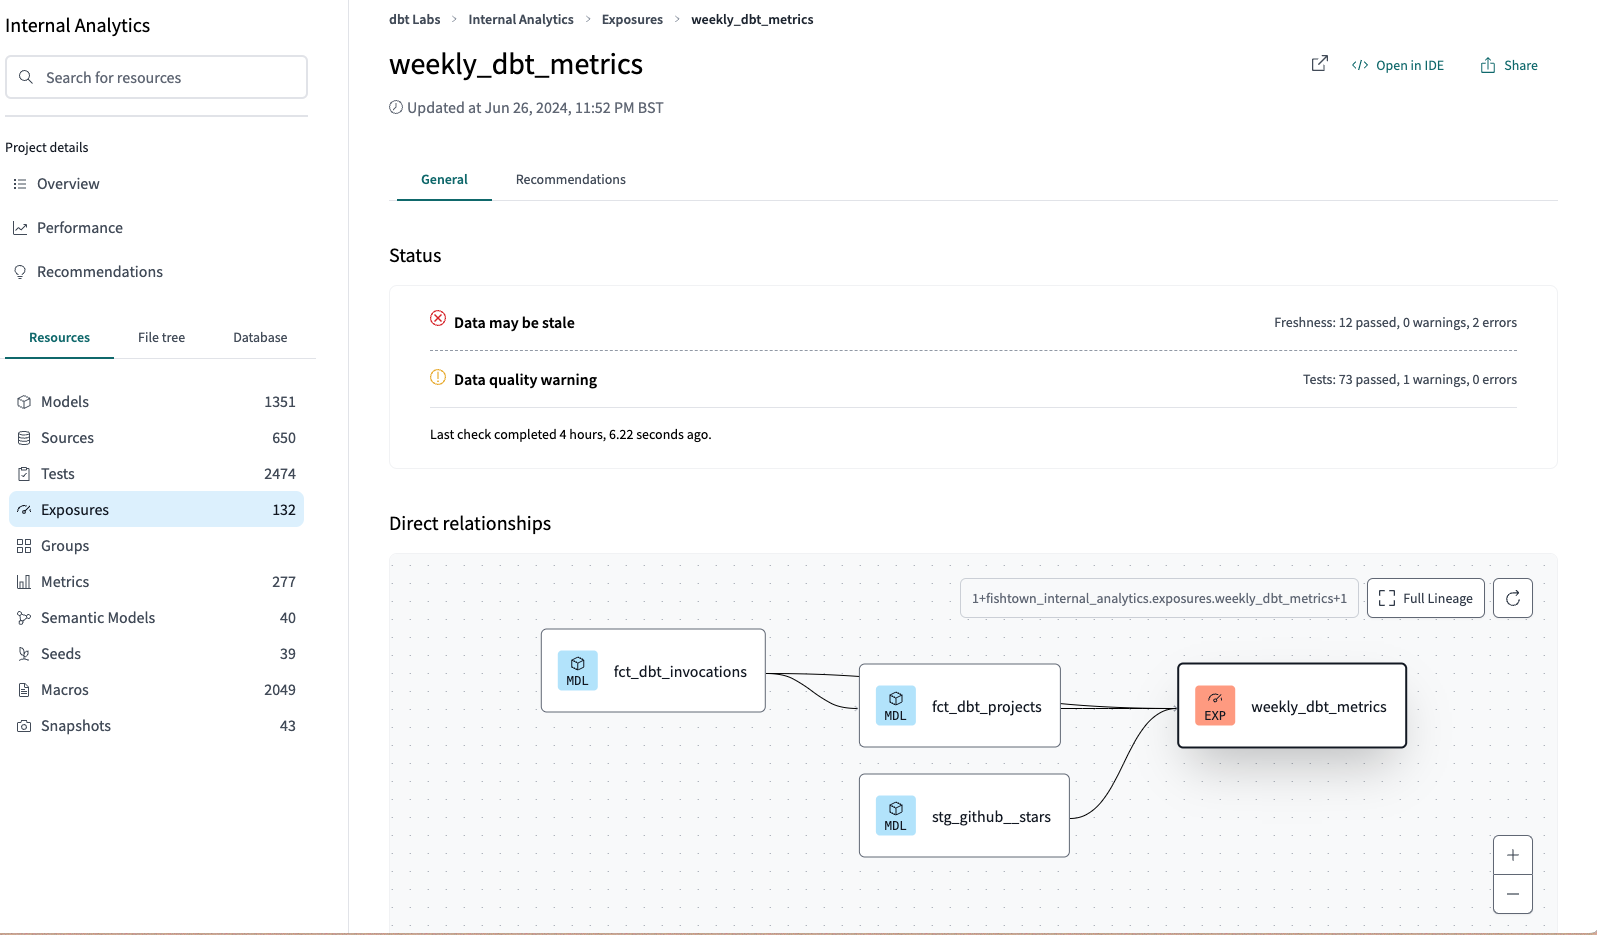
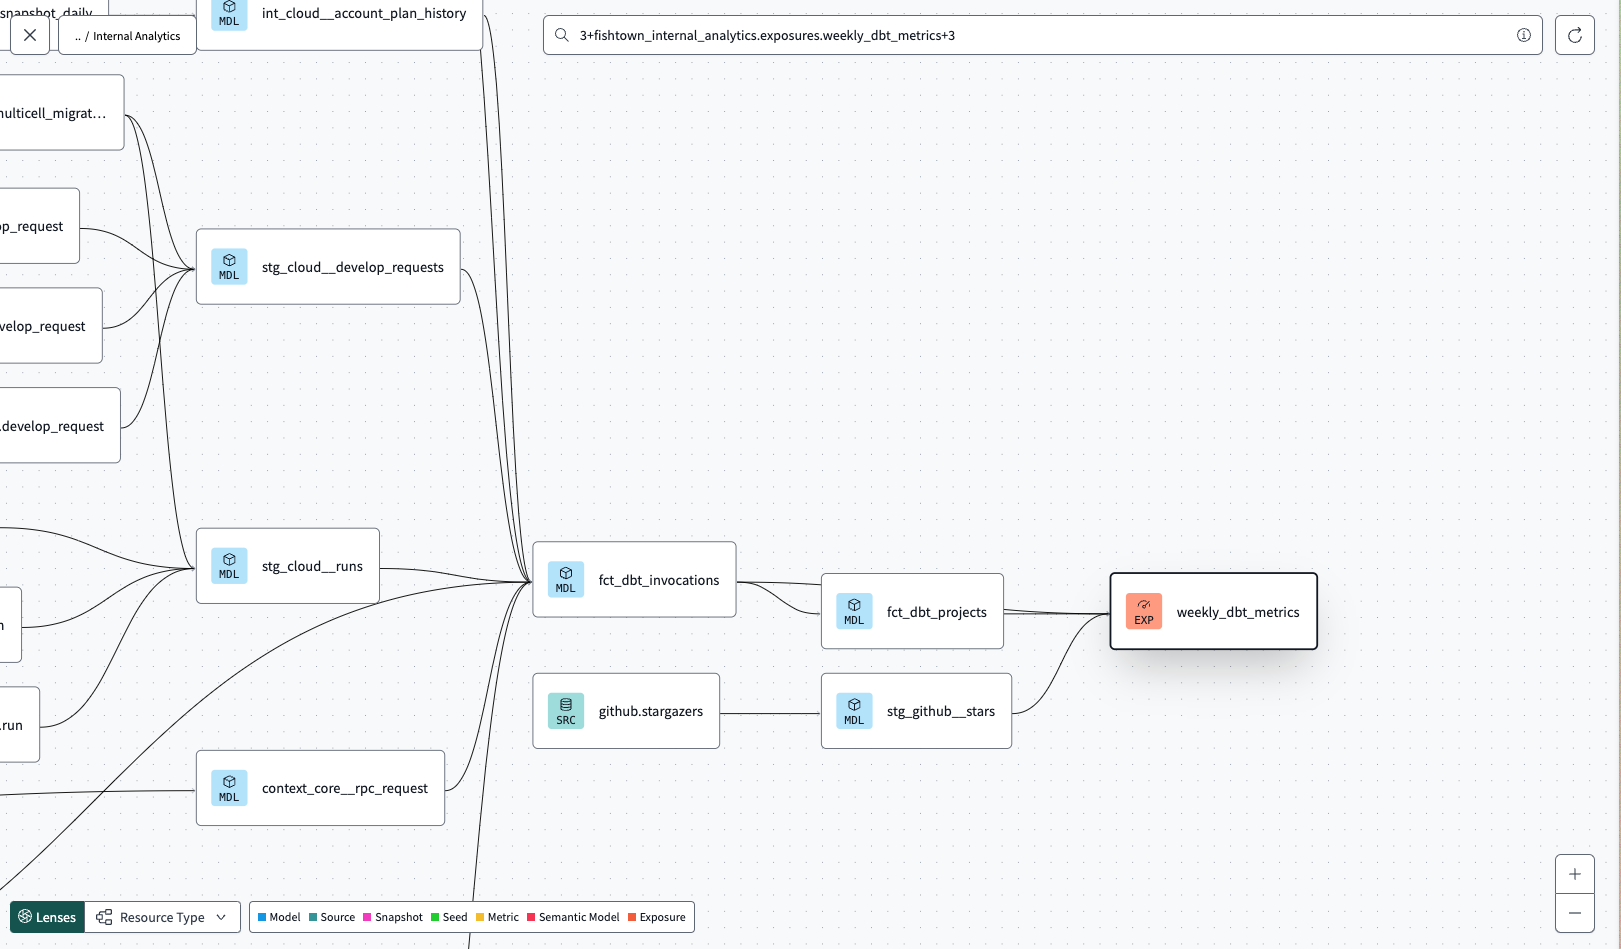
When we generate the dbt Explorer site, you'll see the exposure appear:
 Exposures has a dedicated section, under the 'Resources' tab in dbt Explorer, which lists each exposure in your project.
 Exposures appear as nodes in the dbt Explorer DAG. It displays an orange 'EXP' indicator within the node.
 Related docs
0